
A straightening machine does not produce one number. It produces a distribution: every shaft leaving the cell carries a residual deviation drawn from a spread that depends on incoming bend population, material batch, tooling state and how the machine was set that morning. Cp, Cpk, Pp and Ppk are the language that turns that distribution into a decision — is this process capable, and will it stay capable next week?
Applying process-capability indices to a straightening line requires answering five questions first:
- Is the measurement system good enough to see process variation at all — or are we computing capability on gage noise?
- What is the characteristic — a signed bend value with a target, or an unsigned deviation (TIR, total straightness) with a one-sided limit?
- Which σ goes into the index — within-subgroup short-term variation (Cpk) or long-run total variation (Ppk)?
- How stable is the incoming bend population between batches, and does the index need to absorb that?
- What index value does the customer actually contract at FAT and in series production?

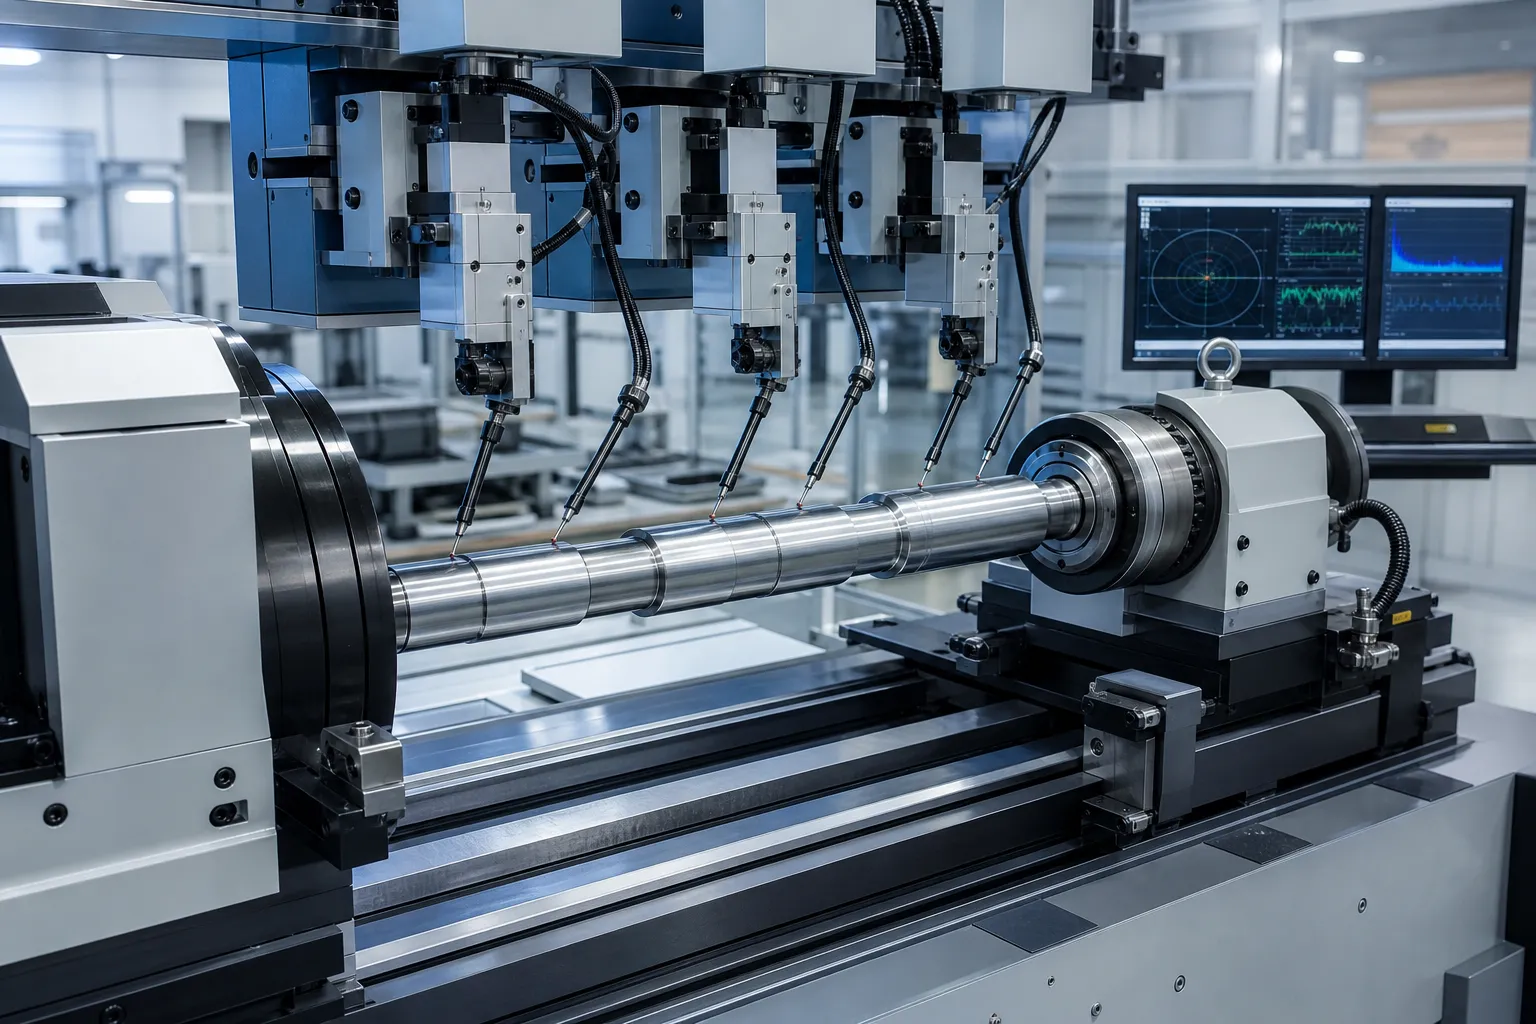
*Jeni konsèp ilistrasyon: capability tracking applied to straightening output. Se pa yon foto kliyan-sit. Capability conclusions for a specific line require validated measurement data from representative parts.*
What the Search Results Say — and Why They Fall Short
Rezilta DataForSEO pou cpk in straightening return generic Six Sigma explainers: Cp and Cpk definitions, formula walkthroughs and calculator pages. Nothing on the first page addresses a straightening process — which is telling, because straightening breaks several textbook assumptions these pages rely on. The indices are standard; their application here is not.
The Four Indices in One Table
All four indices compare the distance between the process spread and the specification limits. The formulas below are the standard versions found in any SPC reference:
| Endèks | Formula | Variation Used | Kesyon Li Repons |
|---|---|---|---|
| Cp | (USL − LSL) / 6σwithin | Short-term, within-subgroup | How good could this process be if perfectly centered? |
| Cpk | min((USL − μ), (μ − LSL)) / 3σwithin | Short-term, within-subgroup | Is the process centered and tight enough today? |
| Pp | (USL − LSL) / 6σoverall | Long-term, all data | How wide is the total spread across runs? |
| Ppk | min((USL − μ), (μ − LSL)) / 3σoverall | Long-term, all data | Is the whole history acceptable, drift included? |
The practical reading: Cpk describes the process the machine can hold over a short demonstration — which is why it dominates factory acceptance conversations. Ppk folds in everything that happens across shifts, batches and tooling changes — which is why it dominates series-production quality reviews. A straightening line with Cpk 1.5 at FAT and Ppk 0.9 after three months is not a contradiction; it is a diagnosis.

The Gate Before the Math: Validate the Measurement
Capability indices divide process spread by gage-inclusive spread. If the measurement system contributes a large share of observed variation, the indices measure the gage, not the machine. Before quoting any Cpk figure, run a measurement system analysis on the exact straightness inspection the line will use — same supports, same probes, same operators. Our guide on Gage R&R pou redresman liy yo walks through acceptance thresholds and common failure modes. A second, straightening-specific trap: measuring parts under load versus after release returns systematically different values, and mixing the two conditions inflates σoverall with pure method error — the distinction is treated in chaje vs lage mezi dwat.
Where Straightening Breaks the Textbook
Unsigned characteristics are not normal. Textbook Cp/Cpk assume a normally distributed, two-sided characteristic. But straightness deviation and TIR are unsigned: they cannot go below zero, so their distribution is typically right-skewed, bounded at zero, with a tail toward the tolerance limit. Two consequences follow. Premye, plug-in normal-theory Cpk values will look pessimistic on such data (the skew inflates apparent tail risk) or hide real tail behavior depending on how σ was estimated. Dezyèmman, many plants sidestep the issue by capability-analyzing a signed quantity instead — bend magnitude and direction at a fixed section, or peak-to-peak deviation per span — which behaves far more normally. Whichever route you choose, state the characteristic definition in the capability plan, not only the index value.
The process adjusts the mean on purpose. Straightening exists to move μ. Every correction press shifts the center of the residual-bend distribution toward zero. That means classical control-chart discipline (investigate when the mean moves) coexists with a process whose normal mode of operation is moving the mean. Subgroup structure must reflect this: sample after correction within a settled recipe, not across recipe changes, or σwithin is polluted by intentional adjustments.
Incoming variation is part of your capability story. A straightening cell sits downstream of forming, heat treatment and transport, all of which shift the incoming bend population. When incoming material worsens, Ppk falls even though the machine changed nothing. That is precisely why batch-to-batch bend variation deserves its own tracking — see springback variation in straightening — and why capability contracts should define the incoming bend envelope the index is valid for.
Sample Size and Subgroup Strategy
Common industrial practice for a capability demonstration on a straightening line runs 25–30 subgroups of consecutive corrected parts, or a single validated run of 100–125 parts for an initial Pp/Ppk snapshot with the usual caution about confidence intervals at small n. For machines with automatic multipoint measurement, the marginal cost of data is near zero, and full-population statistics become the norm — every part is measured anyway, which is the cleanest possible basis for Ppk. The sampling question then shifts upstream: are the parts in the run representative of the full incoming bend range, or did we demonstrate capability on an easy batch? Atik nou an sou full-length profile straightness scanning covers what to record per part so the dataset supports capability analysis later.
Using the Indices at FAT and in Production
A defensible structure separates the two uses. At FAT, demonstrate Cpk on a defined part set, incoming bend envelope, measurement method and acceptance limit — typically Cpk ≥ 1.33 against the internal target value, not the full drawing tolerance, so the band edge retains its protective margin. In series production, monitor Ppk over rolling windows and react to its decay as a maintenance and incoming-material signal. When Ppk drops while Cpk holds, the machine is fine and its inputs changed. When both drop together, look at tooling wear, probe condition and machine health. The sorting and rework consequences of a drifting distribution — how many parts fall beyond the limit and what to do with them — are covered in NOK klasman ak retravay limit nan yon liy redresman.
| Symptom | Likely Meaning | First Response |
|---|---|---|
| Cpk high, Ppk low | Machine stable, inputs drifting | Audit incoming bend population and batch mix |
| Cpk and Ppk both low | Short-term spread too wide | Check springback compensation settings, zouti, probe repeatability |
| Cpk low, Ppk high | Subgroups span recipe changes | Restructure sampling around settled recipes |
| Indices fine, field failures | Wrong characteristic being tracked | Re-derive from functional requirement; check loaded-vs-released condition |
Springback behavior ties the statistics back to physics: if the same press displacement produces different residual bend because of material lot differences, no sampling scheme fixes it — the compensation model must adapt. The mechanism and correction logic are detailed in konpansasyon springback nan redresman arbr.
From Index to Yield: What the Numbers Buy You
Capability thresholds are not rituals; they map directly to expected out-of-specification rates under the normal model. A process running at Cpk 1.00 sits one full tolerance-side margin of 3σ from its nearest limit, corresponding to roughly 2,700 parts per million outside a two-sided band. Cpk 1.33 moves the margin to 4σ, around 60 ppm; Cpk 1.67 reaches 5σ, a fraction of a part per million. On a straightening line producing 300,000 shafts a year, the difference between Cpk 1.0 and Cpk 1.33 is the difference between several hundred suspect parts per year and a handful — which is exactly why automotive and similar customers contract at 1.33 as the entry threshold rather than treating it as an aspiration.
The same arithmetic explains why the internal correction target matters so much. Straightening against a target at the inner half of the band effectively tightens the working specification, and the capability index must be computed against that working limit — not the drawing limit — to reflect what the process is actually asked to hold. This is also the honest way to compare suppliers: a Cpk 1.4 against a 60%-of-band target represents more real protection than a Cpk 1.6 against the full band with no margin left for stress relaxation and handling.
One further benefit accrues to automated cells. Because an automatic straightening machine measures every part anyway, the capability dataset accumulates continuously at zero marginal cost, and Ppk becomes a live process signal rather than a quarterly study. Cells that archive per-part profiles — magnitude, direction and location of residual bend — can also diagnose kote in the part population the tail is growing, which manual sampling almost never catches in time.
Common Mistakes
- Computing Cpk before Gage R&R. If the gage consumes most of the tolerance, every index is fiction.
- Normal-theory indices on unsigned TIR data without comment. State the characteristic, or capability-analyze a signed bend quantity instead.
- Demonstrating Cpk on easy incoming parts. Define the incoming bend envelope in the FAT protocol.
- Treating Ppk decay as a machine problem by default. It is usually an input problem; check material first.
- Quoting Cpk against the full drawing tolerance. The internal target should sit inside the band; capability against the relaxed limit overstates real performance.
Kesyon yo poze souvan
What Cpk should a straightening process achieve?
Industry convention is Cpk ≥ 1.33 for an established capable process and ≥ 1.67 where the characteristic is safety- or function-critical — the same thresholds used across machining. What matters more than the number is the basis: characteristic definition, measurement validation, incoming envelope and whether the index is against the internal target or the drawing limit. A Cpk quoted without those four definitions is not comparable between suppliers.
Is Cpk or Ppk more important for straightening?
They answer different questions. Cpk proves the machine recipe works over a short demonstration — the FAT question. Ppk proves the whole production system holds over time — the warranty question. A straightening supplier who quotes only Cpk is showing you the machine; ask for Ppk history to see the process.
Can capability indices handle skew in straightness data?
Wi, but not by pretending the skew away. Options used in practice include capability-analyzing signed bend values (which behave more normally), applying non-normal or percentile-based methods, or reporting yield-based figures such as expected PPM alongside the classical index. Whichever is chosen, the method must be stated in the capability plan so trend comparisons stay valid.
Build the Capability Case Into the Line
Capability is not an after-the-fact statistic; it is designed into the line through validated measurement, structured data capture and a defined correction target. Lekti ki gen rapò: ki jan otomatik arbr redresman travay for the machine architecture behind closed-loop correction, epi lis verifikasyon machin redresman FAT la for structuring the acceptance test that will produce your first Cpk dataset.
To discuss capability targets for your parts — characteristic definition, measurement plan and the index thresholds we commit to at FAT — contact our engineering team with part drawings and a sample of the incoming bend population.